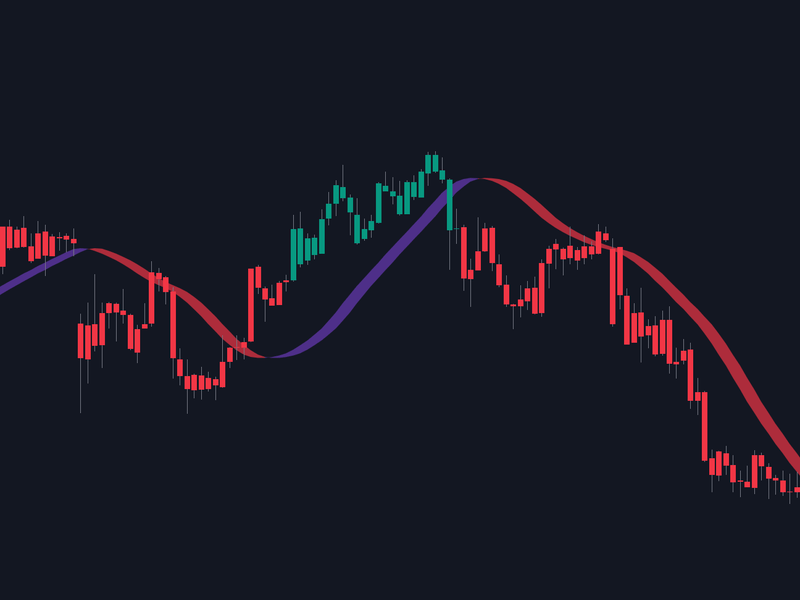
Trend Analyzer Wave helps to analyze the current market trend in which the blue line shows the Uptrend and the red line shows the Downtrend.
Blue Color – Shows the upward momentum of the market. Fresh bullish entries can be created once the wave turns blue on the chart, as well as it could be the exit signal for the bearish entries.
Red Color – Shows the downward momentum of the market. Fresh bearish entries can be created once the wave turns red on the chart, as well as it could be the exit signal for the bullish entries.

